
Implementing a robust data quality management strategy starts with tracking the right data quality KPIs. Without them, poor data quality stays an abstract concern rather than something you can manage, and it's an expensive concern to leave abstract.
The challenge most teams run into isn't a lack of enthusiasm for measuring data quality, it's a lack of clarity about what to measure, and how the different layers of measurement relate to each other.
In this article, we'll be covering the six core metrics that matter most, how they differ from dimensions and KPIs, the operational metrics that tell you how fast you catch a problem rather than just whether your data looks good on paper, and how to turn all of this into an improvement plan.
Key takeaways
- Data quality metrics are the specific, quantifiable measurements used to assess dimensions like completeness and accuracy, distinct from the dimensions themselves and from KPIs, which tie those metrics to business goals.
-
The six core metrics worth tracking are completeness, accuracy, consistency, validity, timeliness, and integrity, and together they give a structural picture of your data's health.
-
Operational metrics like Mean Time to Detect and Mean Time to Resolve matter just as much as structural ones, since they determine how much damage a quality issue causes before anyone catches it.
-
Poor data quality costs organizations an average of $12.9 million a year, according to Gartner, making these metrics a business concern, not just a technical one.
-
AI systems amplify whatever quality issues already exist in their training data, which is why these metrics matter more, not less, as AI adoption grows.
- A data quality dashboard should track these metrics continuously, built into your data platform itself, rather than as a one-time assessment or a bolted-on afterthought.
What are data quality metrics?
Data quality metrics are the specific, measurable indicators used to assess how well your data performs against a defined standard. They turn a vague sense that "something feels off" with your data into a concrete number you can track, compare, and improve over time, which matters given that poor data quality costs organizations an average of $12.9 million a year, according to Gartner.
These metrics benchmark how useful and relevant your data is, helping you differentiate between high-quality data and low-quality data.
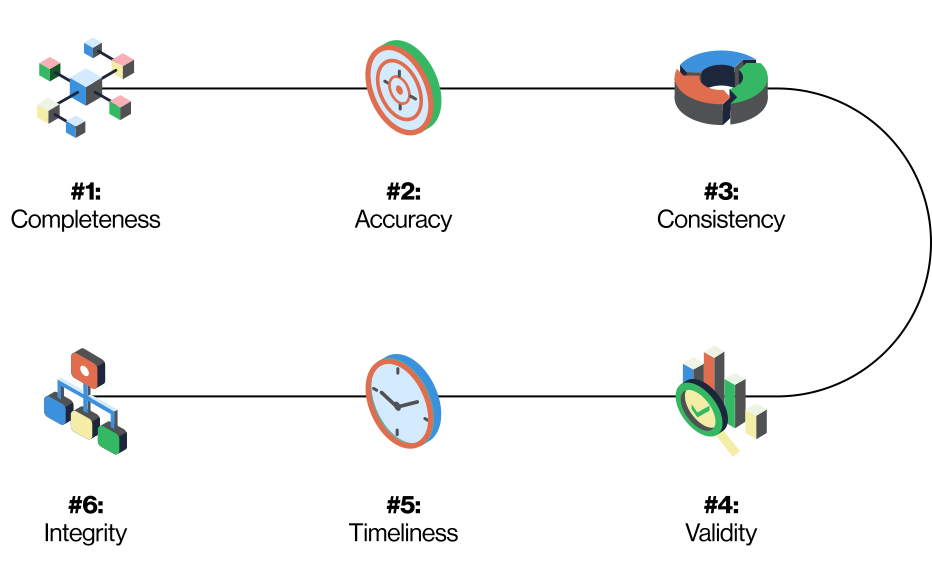
The 6 Essential Data Quality Metrics
- Completeness - Percentage of populated fields
- Accuracy - Correctness vs. real-world values
- Consistency - Synchronicity across systems
- Validity - Conformance to required formats
- Timeliness - Currency and relevance
- Integrity - Preservation across transfers
Why tracking data quality metrics matters for enterprise success
Without quantifiable data quality metrics, you can't demonstrate ROI, prioritize improvements, or prevent problems before they impact the business.
Organizations that systematically track data quality metrics reduce data-related costs while improving decision-making speed.
For mid-senior technical leaders, establishing robust data quality measurement builds organizational trust in data-driven decisions and prevents the $12.9 million in annual losses that poor data quality can create for enterprises.
Data quality dimensions vs metrics and KPIs: What's the difference?
Dimensions, metrics, and KPIs are often used interchangeably, but they describe three distinct layers of measuring data quality.
Dimensions are the conceptual groupings, completeness, accuracy, consistency, and so on, the broad categories that describe what "good" data quality means.
Metrics are how you measure a dimension in practice, a specific, quantifiable number like "the percentage of customer records missing a phone number." KPIs go one step further, tying a metric to a business goal, for example, treating that same completeness metric as a KPI if your team has committed to keeping it above 98% this quarter.
Getting this distinction right matters practically. A team that treats every dimension automatically as a KPI ends up trying to hit an arbitrary target on everything at once, rather than identifying which specific metrics connect to a business outcome worth prioritizing this quarter.
Not every dimension needs a formal KPI attached to it, some just need to be monitored, with a KPI reserved for the ones tied to a specific initiative.
You'll find some sources list more dimensions than others, relevancy, auditability, and uniqueness show up in several frameworks alongside the six covered here. That's not a contradiction so much as a reflection of different organizations prioritizing different things. The six covered in this article are the practical core set worth tracking first, the ones that show up as concrete business impact across the widest range of use cases.
Building your data quality framework
When faced with budgetary constraints, bureaucracy, complex systems, and an ever growing list of security and compliance regulations you need to know that your efforts are providing you with higher-quality data.
These six data quality metrics are the key place to start. Measuring these, and continually assessing them, enables you to measure the impact your efforts are having.
6 data quality metrics to track
Here are the six metrics that matter most, and why each one earns its place on this list.
1. Completeness
Data completeness is the measure of whether all necessary data is present in a dataset, calculated as the percentage of data fields that contain values versus those that are empty or null.
Data completeness can be assessed in one of two ways, at the record level, or at the attribute level.
Measuring completeness at the attribute level is a little more complex however, as not all fields will be mandatory.
Why data completeness matters for enterprise data quality
Data completeness directly impacts your ability to generate actionable insights and maintain operational efficiency. When critical fields like customer contact information or financial transaction details are missing, downstream processes can fail, whether that's automated workflows or compliance reporting, leading to business risk. And as AI becomes more embedded in processes, more complete data will give you better outcomes.
Key business impacts:
- Revenue loss: Incomplete customer data can result in failed transactions, missed revenue opportunities, ineffective marketing campaigns and poor customer experiences.
- Compliance risk: Missing mandatory fields can trigger regulatory violations and audit failures.
- Operational inefficiency: Teams can waste hours of time hunting for missing information rather than adding value.
- AI/ML failures: Machine learning models trained on incomplete data produce unreliable predictions.
An example metric for completeness is the percent of data fields that have values entered into them.
2. Accuracy
Accuracy measures how closely your data reflects the real-world entity or event it's supposed to represent.
Data accuracy is the extent to which data is correct, precise, and error-free.
In many sectors like the financial sector, data accuracy is black-and-white. it either is or isn't accurate. Data accuracy is critical in large organizations, where the penalties for failure are high, and in all organizations inaccurate data can flow downstream and cause impact throughout the business.
The need for accuracy is a key reason that domain experts - even if they're not technical - should be closely involved in data processes, so they can use their expertise to make sure data is correct.
Why accuracy matters for enterprise data quality
Data accuracy is the foundation of trustworthy decision-making and directly affects your bottom line. When data doesn't reflect reality, stakeholders lose confidence in your entire data ecosystem. In industries like healthcare and finance where accuracy is mission-critical, even a 1% error rate can result in life-threatening mistakes or catastrophic financial losses.
Key business impacts:
- Financial losses: Wrong pricing data, billing errors, and inventory miscounts directly reduce profitability.
- Regulatory penalties: Inaccurate reporting to regulatory bodies can result in fines and legal consequences.
- Customer churn: Incorrect customer data leads to poor experiences and damaged relationships.
- Strategic failures: Executive decisions based on inaccurate data can misdirect entire business strategies.
An example metric for accuracy is finding the percentage of values that are correct compared to the actual value.
3. Consistency
Data consistency is the measure of whether the same data maintains identical values across different databases, systems, and records, calculated as the percentage of matching values across all data repositories.
Maintaining synchronicity between different databases is essential. To ensure data remains consistent on a daily basis, software systems and good reference data management practices are often the answer.
One client using CloverDX to improve their data quality saved over $800,000 by ensuring phone and email data consistency across their databases. Not bad for a simple adjustment to their data quality strategy.
Why consistency matters for enterprise data quality
Data consistency ensures your organization speaks with one voice across all systems and departments. When customer information differs between your CRM, billing system, and customer service platform, teams waste countless hours reconciling discrepancies while customers receive conflicting communications. Organizations with poor data consistency experience longer time-to-insight as analysts struggle to determine which version of data to trust.
Key business impacts:
- Operational confusion: Different departments working from conflicting data make contradictory decisions and waste time figuring out which data is correct.
- Customer frustration: Inconsistent customer records lead to repeated information requests and poor service.
- Audit failures: Inconsistent financial or compliance data raises red flags during regulatory reviews.
- Integration failures: Data inconsistency between systems prevents successful enterprise integration projects.
An example metric for consistency is the percent of values that match across different records/reports.
Building data pipelines to handle bad data
How to build data quality and data validation into every step of your data pipeline.

4. Validity
Validity measures whether data conforms to the required format, type, or range, a date that's a properly formed date, a phone number with the right number of digits.
Data validity is the degree to which data adheres to specified formats, acceptable value domains, and business logic rules, ensuring that data entries meet organizational standards and requirements - for example, ensuring dates conform to the same format, e.g. MM/DD/YYYY.
If we take our previous case study as an example, the company relied on direct mail. But without the correct address formatting it was hard to identify household members or employees of an organization. Improving their data validation process eliminated this issue for good.
Why validity matters for enterprise data quality
Data validity ensures your systems can actually use the data they contain. Invalid data - whether incorrectly formatted dates, out-of-range values, or non-standard codes - breaks automated processes and requires expensive manual intervention. Organizations that don't enforce validity rules at data entry points spend a significant amount of data management time and effort on downstream cleansing efforts.
Key business impacts:
- System failures: Invalid data causes automated processes and integrations to fail or produce errors.
- Analytics paralysis: Data teams spend weeks cleaning and reformatting data instead of generating insights.
- Poor customer experience: Poor data validity makes it impossible to identify data patterns or organizational relationships, and can result in irrelevant or undeliverable communications and wasted marketing spend.
An example metric for validity is finding the percentage of data that have values within the domain of acceptable values.
5. Timeliness
Timeliness measures whether data is available when it's needed, and how current it is relative to the real-world event it describes.
Data timeliness also measures whether information is sufficiently up-to-date for effective decision-making and operational needs.
An example of this is when a customer moves to a new house, how timely are they in informing their bank of their new address? Few people do this immediately, so there will be a negative impact on the timeliness of their data.
Poor timeliness can also lead to bad decision making. For example, if you have strong data showing the success of a banking reward scheme, you can use that as evidence you should continue.
But you shouldn’t use the same data (from the initial 3 months) to justify the schemes extension after 6 months. Instead, update the data to reflect the 6-month period. In this case, old data with poor timeliness will hamper effective decision making.
Why timeliness matters for enterprise data quality
Data timeliness determines whether your organization is making decisions based on current reality or outdated information. In today's fast-paced business environment, yesterday's data can lead to tomorrow's failures. When data lags, analysis and forecasting becomes guesswork.
Key business impacts:
- Missed opportunities: Outdated market data means you respond to trends after competitors have already capitalized.
- Poor forecasting: Historical data used beyond its relevance window produces inaccurate predictions.
- Customer dissatisfaction: Outdated customer preferences lead to irrelevant communications.
- Inventory problems: Delayed stock data causes both overstocking (wasted capital) and stockouts (lost revenue).
An example metric for timeliness is the percent of data you can obtain within a certain time frame, for example, weeks or days.
6. Integrity
Integrity measures whether relationships between different pieces of data remain intact and correctly linked, an order record that still correctly points to its customer record, for instance.
Data integrity is the measure of whether data remains accurate, complete, and consistent as it moves between different systems and databases, calculated as the percentage of data that remains unchanged and uncorrupted during transfers and updates.
To ensure data integrity, it’s important to maintain all the data quality metrics we’ve mentioned above as your data moves between different systems.
Typically, data stored in multiple systems breaks data integrity. For example, as client data moves from one database to another, does the data remain the same? Or, equally, are there any unintended changes to your data following the update of a specific database? If the answer is no, the integrity of your data has remained intact.
Why integrity matters for enterprise data quality
Data integrity is the ultimate measure of whether your organization can trust data as it flows through complex enterprise architectures. When data loses integrity during transfers between systems, the entire data ecosystem becomes suspect. A single integrity failure can corrupt downstream analytics, trigger incorrect automated decisions, and create a domino effect of errors that take weeks to trace and correct. Organizations that fail to maintain data integrity face a crisis of confidence where business users stop trusting data altogether.
Key business impacts:
- System-wide corruption: Integrity failures in one system can propagate errors across your entire data ecosystem.
- Migration failures: Lack of integrity during system migrations can derail transformation projects.
- Trust erosion: Data integrity failures destroy stakeholder confidence in your entire data infrastructure.
- Compliance violations: Undetected data alterations during transfers can violate regulations like GDPR.
An example metric for integrity is the percent of data that is the same across multiple systems.

Why these metrics matter even more for AI
Every metric covered above matters for traditional reporting and analytics. They matter more, not less, once AI enters the picture.
An AI model doesn't apply judgment to a messy input the way a person reviewing a report might, it learns the pattern in front of it, including the pattern of the errors. Incomplete training data doesn't just create gaps in a model's knowledge, it teaches the model that certain situations simply don't exist. Inconsistent data teaches a model that the same entity is several different ones. Poor timeliness means a model trained on outdated patterns keeps confidently repeating them long after the real world has moved on.
This is why organizations further along in AI adoption tend to treat these six metrics, and the operational ones that follow, as infrastructure rather than a compliance checkbox. A model is only ever as reliable as the data quality behind it, and unlike a human analyst, it won't flag its own confusion.
Operational metrics that matter: MTTD, MTTR, and data freshness
The six dimensions above tell you what good data looks like structurally, but a handful of operational metrics tell you how fast you catch it when something goes wrong, and how current your data stays in between.
Mean Time to Detect (MTTD) measures how long it takes to identify a data quality issue after it occurs. Mean Time to Resolve (MTTR) measures how long it takes to fix it once it's found.
Benchmarking research from data engineering teams suggests teams without automated monitoring can take roughly four times longer to detect an issue than teams with it in place, a gap that matters because most of the business damage from a quality failure happens in the window before anyone even knows there's a problem.
These metrics connect directly to one of the most common causes of quality issues in the first place: schema drift, when a column is added, removed, or renamed upstream without warning.
A low MTTD means you catch that kind of change within minutes rather than discovering it three reports later, once the bad data has already spread. A related, specific metric worth tracking alongside MTTD is your schema validation pass rate, the percentage of incoming records that pass structural checks cleanly, since a sudden drop is often the earliest visible sign that a source system has changed upstream.
Data freshness, and how consistently you meet a defined freshness SLA, is a third operational metric worth setting a target for explicitly. A dashboard that's technically accurate but refreshes six hours late is giving decision-makers a picture of a world that's already moved on. Setting a concrete freshness target, for example, committing to data being no more than 30 minutes old for a specific pipeline, turns "the data feels stale sometimes" into something you can monitor and alert on.
Tracking these operational metrics alongside the six structural ones gives you a complete picture, not just whether your data meets a defined standard, but how quickly your organization notices and reacts when it doesn't.
A team with excellent completeness and accuracy scores but a multi-day MTTD is still exposed to real risk, since a fast-moving issue, a broken feed, a misconfigured integration, can do significant damage in that window regardless of how well-defined your quality rules are on paper.
It's worth considering data observability beside your data quality measurement. Data quality metrics ask whether your data meets a defined standard. Data observability metrics ask whether your pipelines themselves are healthy, tracking things like pipeline uptime and volume anomalies alongside freshness and schema changes.
The two overlap deliberately, MTTD and schema validation pass rate sit in both worlds, but observability is the broader discipline, while data quality metrics stay focused specifically on the data's own fitness for purpose.

Which metrics matter most depends on your industry
Not every organization should weight these six metrics equally. The right priority order tends to follow directly from what a bad outcome costs in your specific industry.
A bank or insurer is likely to weight accuracy and integrity most heavily, since a broken link between a transaction and the account it belongs to is a far more serious failure than a slightly stale dashboard.
A retailer running real-time personalization tends to prioritize timeliness and completeness instead, since a recommendation engine working from yesterday's inventory data creates a worse customer experience than a small number of incomplete records.
A healthcare provider will often weight consistency and completeness highest, given how much downstream clinical and billing accuracy depends on the same patient record matching cleanly across systems.
None of this means the other metrics stop mattering, it means the order you tackle them in, and the thresholds you set for each, should reflect where a failure in your specific industry does the most damage, rather than applying a generic priority list built for a different business entirely.
Data quality metrics and regulatory compliance
Several of these metrics aren't just operationally useful, they're tied directly to regulatory obligations. Under GDPR, accuracy and completeness aren't optional nice-to-haves, they're legal requirements tied to an individual's right to have their data corrected or erased, and an organization that can't demonstrate accurate records is exposed to real enforcement risk.
In banking specifically, BCBS 239, the Basel Committee's principles for effective risk data aggregation, explicitly requires banks to demonstrate the accuracy, completeness, and timeliness of the data feeding their risk reports. That's not a general best practice recommendation, it's a named regulatory expectation with the same three metrics covered in this article sitting at the center of it.
The practical implication is that tracking these metrics well isn't purely a data quality exercise, in regulated industries, it's also the evidence base you'd need to produce during an audit. Integrity, in particular, does double duty here: the same audit trail that shows relationships between datasets remain correctly linked is often exactly what a regulator wants to see when asking how a figure in a report was derived.
From data quality assessment to data quality improvement
Measuring these metrics is only valuable if it leads somewhere. A one-time assessment tells you where you stand today, ongoing monitoring and validation tells you whether you're improving, and catches new issues as they emerge rather than waiting for the next scheduled review.
The most effective approach combines structural metrics (the six above) with operational ones (MTTD and MTTR), reviewed on a regular cadence, with clear ownership for who acts when a metric moves in the wrong direction.
Choosing the right data quality software
Reducing data errors will help improve your data insights and analysis, position you to be able to generate better AI outcomes, and ultimately grow your business - while minimizing compliance risks.
While strong data quality management starts with understanding and monitoring the metrics we’ve discussed above, doing this manually is problematic - and becomes impossible at scale.
Data quality is a fundamental component of your overall data strategy. While dedicated data quality tools have their place, the most effective approach integrates data quality management directly into your core data infrastructure.
Rather than bolting on separate validation and cleansing tools that create additional complexity, look for a comprehensive data integration platform that embeds data quality capabilities throughout your entire data pipeline.
The right platform approach means data validation happens at the source, cleansing occurs during transformation, and monitoring is continuous, meaning you catch issues before they propagate downstream, reducing the time and cost of remediation. This integrated approach also eliminates the technical debt and maintenance burden of managing multiple disconnected tools.
What to look for in a data integration platform:
- Continuous monitoring, not just a one-time assessment or scorecard.
- Built-in data validation and cleansing at every stage of your data pipeline
- Automated data quality monitoring that tracks completeness, accuracy, and consistency in real-time
- Unified data quality framework that applies consistent rules across all data sources
- Configurable validation rules that reflect your own business logic, not just generic format checks.
- Embedded profiling and anomaly detection to surface issues proactively
- Clear, actionable error reporting that non-technical staff can act on directly.
- Full audit trails so you can trace exactly where an issue originated.
- Business-user friendliness to enable domain experts to play a vital role in maintaining data quality
- Integration with your existing pipelines, rather than a separate tool that adds another system to maintain.
How CloverDX supports data quality metrics
CloverDX builds validation and profiling directly into your data pipelines, so the metrics covered in this article aren't something you check separately, they're tracked as data moves through your systems.
Configurable, reusable validation rules catch completeness, accuracy, consistency, and validity issues at the point they occur, while full audit trails and error reporting give both technical and non-technical teams the visibility they need to act quickly, directly supporting a lower MTTD and MTTR rather than just a cleaner scorecard.
For an in-depth look at how CloverDX can help you achieve data quality in your business, check out the dedicated data quality solutions page.
Final thoughts: Measure both what and how fast
Tracking the right data quality metrics, structural and operational both, is what turns data quality from a vague concern into something you can manage. Completeness, accuracy, consistency, validity, timeliness, and integrity tell you what good data looks like. MTTD and MTTR tell you how quickly you'll catch it when something isn't.
Neither measurement is optional. A team that only tracks the six structural dimensions can still be caught off guard by how long a problem sat undetected. A team that only tracks detection speed without a clear definition of what "good" looks like has no way to know if what they caught was even worth catching.
Let's talk about what data quality metrics your business needs and what data quality measurement could look like for your team.
.webp)
Share