
Quick Tip - Organizing Executions History

Reusability is very important topic when it comes to job design in CloverDX. We are strong advocates of the DRY principle, which can be a big help during development. There is small culprit when trying to make sense in multiple executions of same, highly configurable job.
Child job tagging
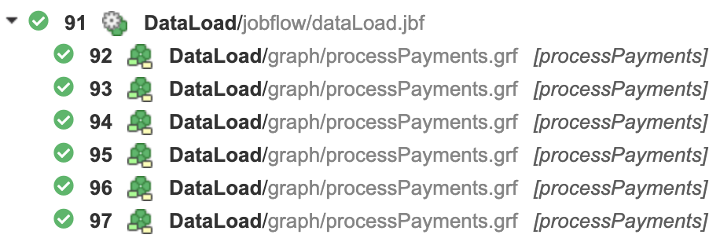
This is extremely helpful during development but may create all kinds of problems for DevOps when not managed properly. For example, the following image outlines multiple processes which read and process Payment files. If one or more of these processes fails, it is virtually impossible to see which file was not possible to load. It could be potentially even worse when the executed process could be a dummy wrapper for something more complex.
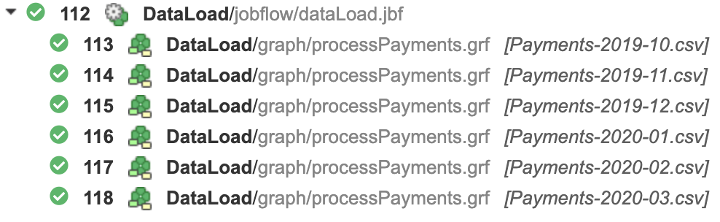
As a developer, you can make browsing through an executions tree way more transparent. It is possible to change labels either via proper naming of any given Subgraph or through the Execution Label property configured directly from configuration dialogue or via Input mapping of ExecuteGraph/ExecuteJobflow. This results in better annotated execution structure and helps pinpoint issues more efficiently.
Default job labels
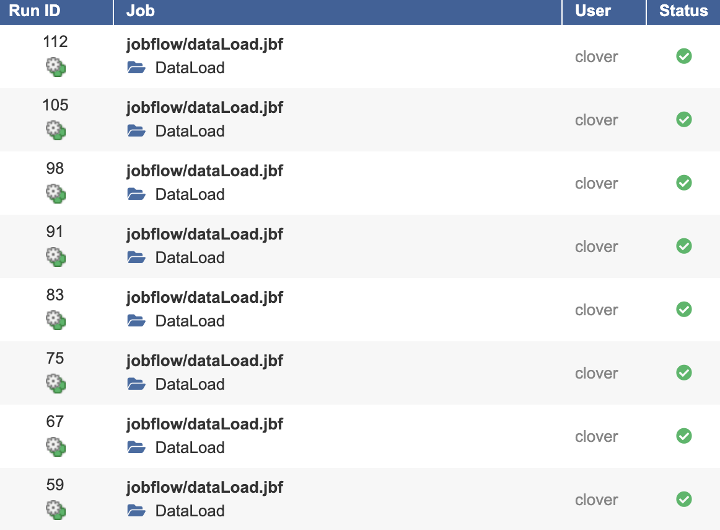
In the case of the same top-level job running multiple times, we will find the picture very like the following one in Execution History. This is also not too helpful when dataLoad.jbf behaves different for each configuration, e.g. loading data for different regions.
It may not be straightforward to identify which region failed to refresh its data. But there is a way to fix it.
Execution Label property can be set also be set in a job file itself and as usual, it can be populated by any job parameter. In our example, dataLoad.jbf also includes one parameter, called REGION. This parameter is used as such a label.
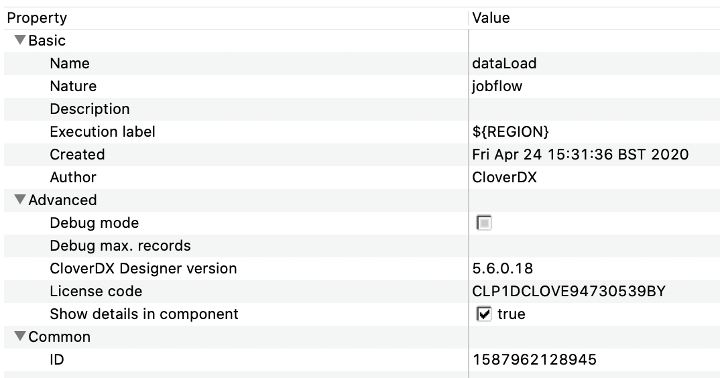
This allows for Executions History be annotated a little better than usual. Each individual trigger provides REGION as means of identification of the data target as well as the appropriate tag for the Executions History listing.
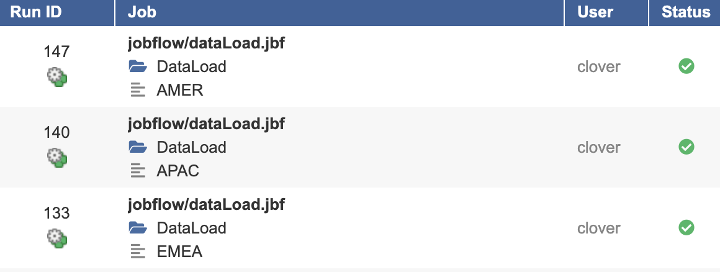
Quite a different picture, right? I hope you will find this tip useful.
More from Tech Blog
-
Server diagnostics: ChatGPT or Claude
Administrating a healthy CloverDX Server usually means correlating information scattered across performance logs, job tracking tables, execution logs,... AI -
Data Quality Examples on GitHub
As our first set of examples, we published a project called DataQualityExamples which demonstrates how users can address their data quality issues with... CloverDX How-To -
Introducing CloverDX Examples on GitHub
We’re excited to introduce the CloverDX Examples repository on GitHub. The repository is a growing collection of helpful and practical examples designed to... CloverDX How-To -
Send Email via Azure Communication SMTP
There are many situations where it is helpful to get a message from your active pipelines. These may include logs, summaries of successful completion, or... Cloud -
Connecting to REST APIs (OpenAPI)
Connecting to REST APIs is a crucial aspect of modern data integration, and the REST Connector in CloverDX provides a streamlined approach. The video below... RESTConnector -
Troubleshoot database-related performance
Performance is undoubtedly one of the key factors when running data transformations. In this article, we will look at how to troubleshoot database-related... Performance
 Read On