
Under the hood of CloverDX Cluster
We frequently get a question what a CloverDX Cluster is, how it works and advise around configuration. So let me shed some light on it as I’ll try to explain some core principles.
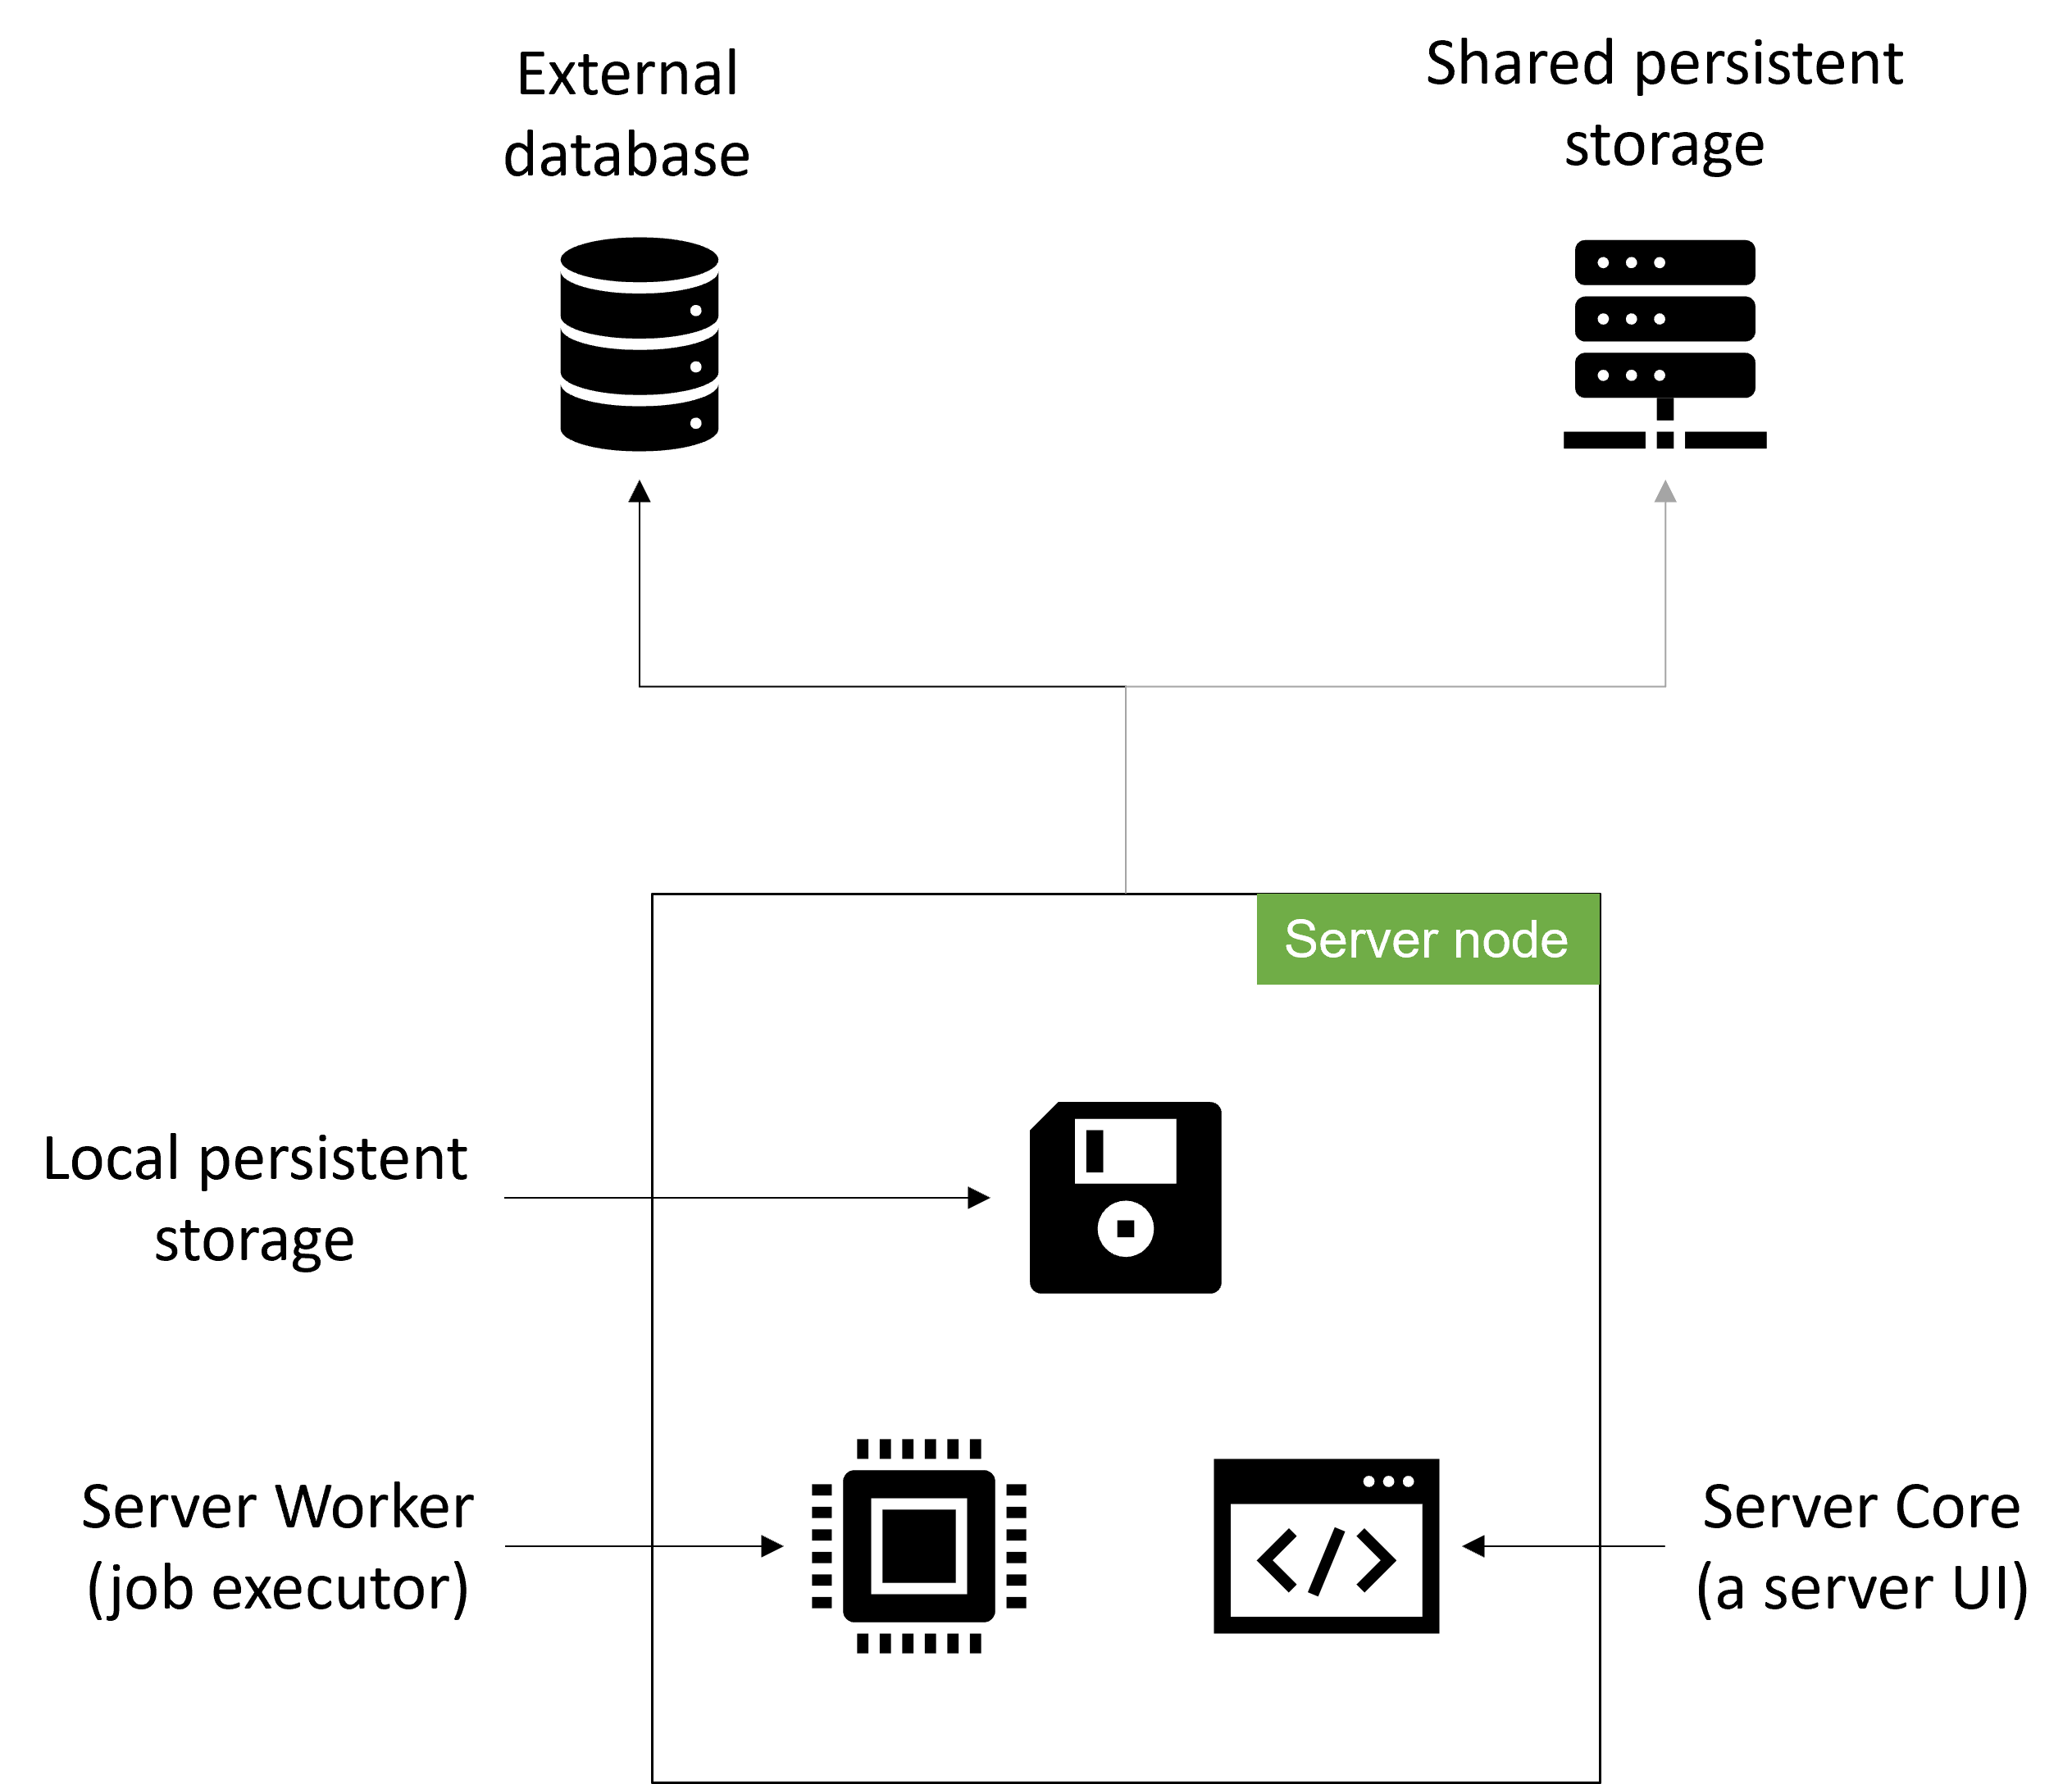
Before we start it may be useful to introduce some basic CloverDX Cluster actors:- External database
- Shared persistent storage
- Local persistent storage
- (Server) Worker
- (Server) Core
- Server node
Basically, Server node is one instance of VM or container where both Worker and Core are running on. Rest, I’ll explain later in architecture chapter.
To help a little with visuals, let’s put these into a diagram.
What is CloverDX Cluster?
It is fair to think about a Cluster as 2+ Server nodes configured to share a database and a sandbox storage. In CloverDX Cluster, each node is equal, working in a consensus. To establish information about overall cluster health, Cluster tightly couples with two external services – relational database and shared filesystem (optional, but strongly recommended).
When shared filesystem is not used and is replaced by synchronized one, some development standards have to be employed to prevent random data access failures.
If a node stops responding, other nodes will flag it as “Suspended” and automatically exclude it from the load balancing algorithm. Suspended nodes are not eligible to receive any workload and for all intents and purposes, it is offline. Node may enter “Suspended” mode due to variety of reasons which may include faulty worker, broken database connection, inability to access project storage, losing a connection to other nodes,… in some of these cases even on its own.
When server node becomes active, it’ll notify other cluster members who will attempt to contact the server and when successful, it will be allowed to (re)join the cluster following same process as brand new node.
CloverDX Cluster architecture
Given the lack of controller or master node, CloverDX Cluster is based on strictly peer-to-peer communication which brings some benefits and of course, some limitations. Most noticeable limitation is an increased network traffic overhead, making cluster not very well suited for distributed (grid) deployments. As grid, I mean setups where individual nodes are distributed across multiple data centers. Due to high(er) latencies, performance may drop and when link is poor random Server node suspensions may occur. Peer-to-peer setup on the other hand, provides increased robustness and better disaster recovery options.
Another benefit (not necessarily an implication of chosen communication schema) is integrated load balancing. Nodes, during heartbeat request exchange an information about current utilization so when new job execution request is created, the least utilized node is chosen to process it.
Load balancing happens automatically but can be overridden or adjusted by configuration options. Given high granularity of these options, it is possible to load balance to selected subset of nodes or single, specific one on a level of particular section of particular job. This is frequently a case when single server has very specific setup to be able to process very particular dataset. E.g., to save license costs for 3rd party software, is only one powerful enough or is simply the only one whitelisted to access a remote datastore.
CloverDX Cluster can accept any number of previously unknown nodes to join operations. These nodes need to have unique names (IDs). Once Server node joins a cluster, It is expected to be part of it for life with expected periods of downtime.
CloverDX Cluster allows for both process-level and row-level load balancing and repartitioning.
External database
Has same role as in single-node setup with some noticeable differences. Generally, database holds all information related to security, automation and sandbox settings, valid for entire cluster. On top of this, status history captures statuses of individual Server nodes (past and current) connected to the cluster.
Shared persistent storage
Otherwise known as shared sandbox directory configured by sandboxes.home property, serves as “source code storage”. An idea of shared persistent storage is to provide each Server node with identical codebase it is supposed to execute.
Even when best practices around deployment are followed and sandboxes.home points to shared (usually mounted via SMB, NFS, …) drive it may occasionally happen, jobs fail with seemingly random error. Typically, the culprit is cache and delayed write-through when protocols push written data to remote storage with a delay. Root cause, in most cases, being poor job design using intermediary files (partial results) between individual jobs in shared sandboxes. Since these jobs may be running on different nodes (depending on current load) where files may not yet be available. Investigation afterwards is usually pointless as file is already written through, turning error message into nonsense. At the time, file indeed was not where it was supposed to be or existing but with an outdated content (in case of data modification).
In case, it is not desirable or technically not possible to have a filesystem shared between Server nodes, it is not hard requirement but make sure sandboxes.home directories are properly mirrored on each Server node. Discrepancies may cause random glitches.
Local persistent storage
This is where software is installed as running. Typically, local persistent storage contains (in addition to software itself) log files, runtime temp (edge buffers, partial results, …) and configuration files.
Before we move to explanation, I’d like to emphasize that local persistent storage is tightly coupled with cluster.node.id property. Therefore, one might think of Node ID as unique identifier of local persistent storage.
Reasons for this can be traced to efforts to minimizing impact on server performance, network traffic and dependency on 3rd party monitoring tools.. Some information about Server node information is persisted locally. If we take logs as an example – when browsing execution history, it is possible to display and download runtime logs. These are taken directly from the instance the job was running at. When node is not available, log cannot be shown as there’s no other node to get it from.
Internal load balancer
There is a common misunderstanding on what is and what is not load balanced. There are three load balancing opportunities when it comes to CloverDX Cluster.
- Access to web frontend
- Data Service (Data App) requests
- Job execution
Only one of these 3 (Job execution) is load balanced by the internal load balancer. To cover the rest, external tool like Apache’s mod_proxy, NGINX, AWS API Gateway,… needs to be used. In simple terms, access to CloverDX Server console or its other HTTP services is not load balanced. Whatever happens internally is.
There is also a rule of thumb – when running a Data Service, job is executed on a node which was accessed. This can be changed if Data Service contains ExecuteGraph or ExecuteJobflow component which will re-balance triggered job to least utilized node.
It is worth noting that even though server is accessible via HTTP(S), it is also capable to run any jobs like Data Services. When requests should be proxied to specific node, load balancer should check http://example.com:8080/clover/api/rest/v1/server REST API whether or not Server is suspended.
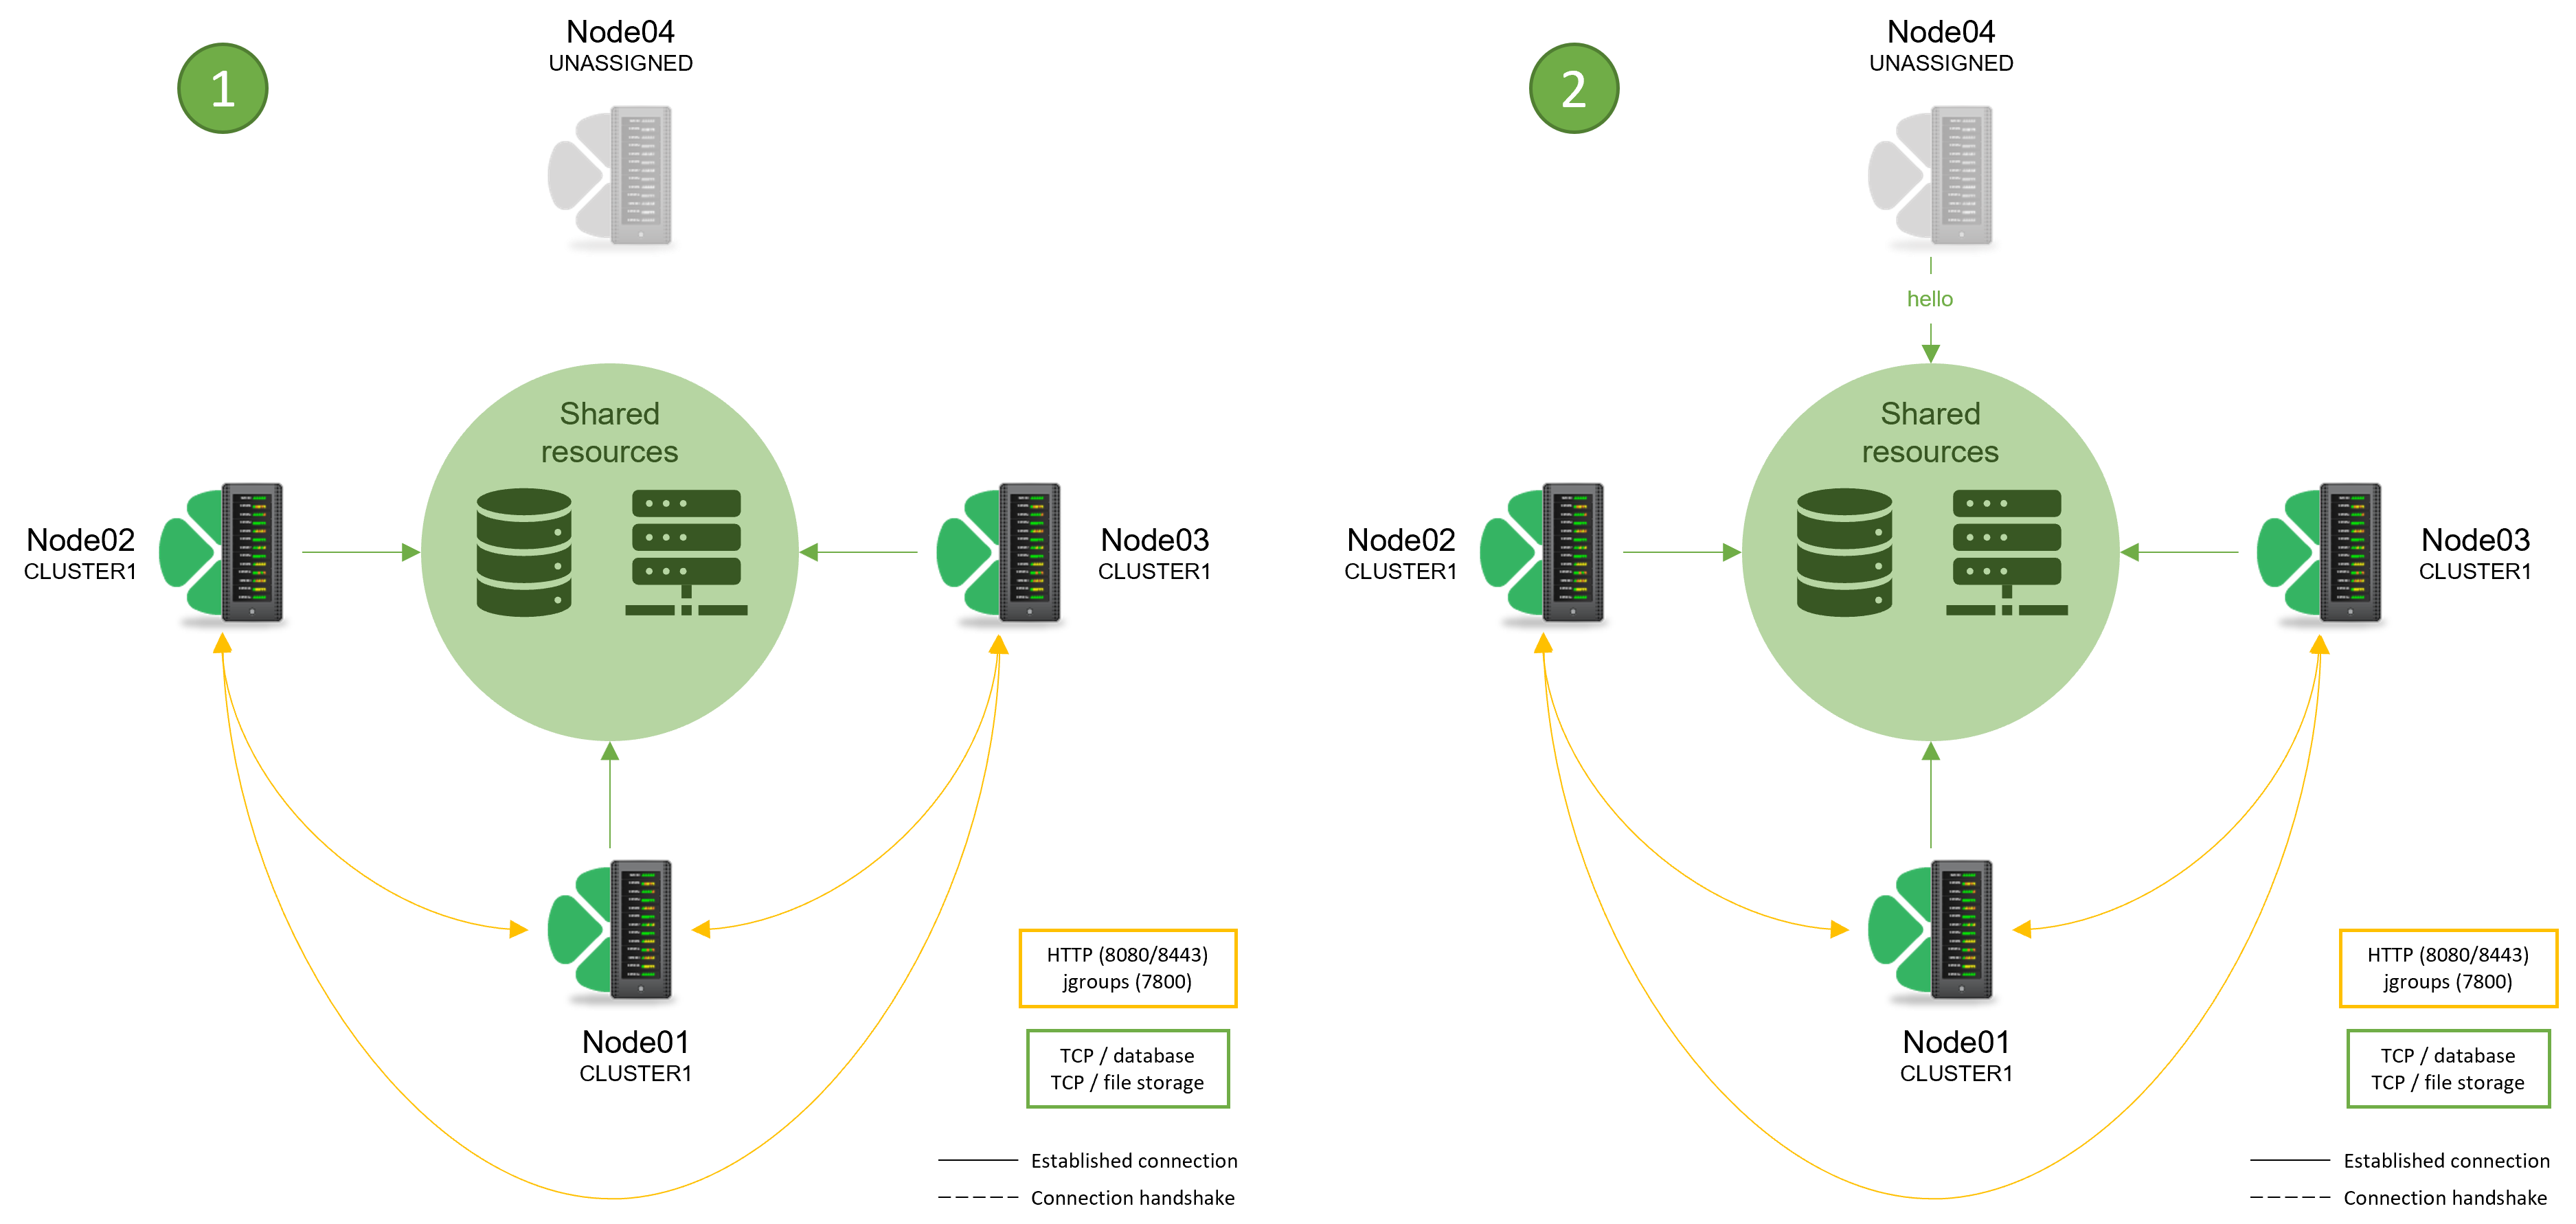
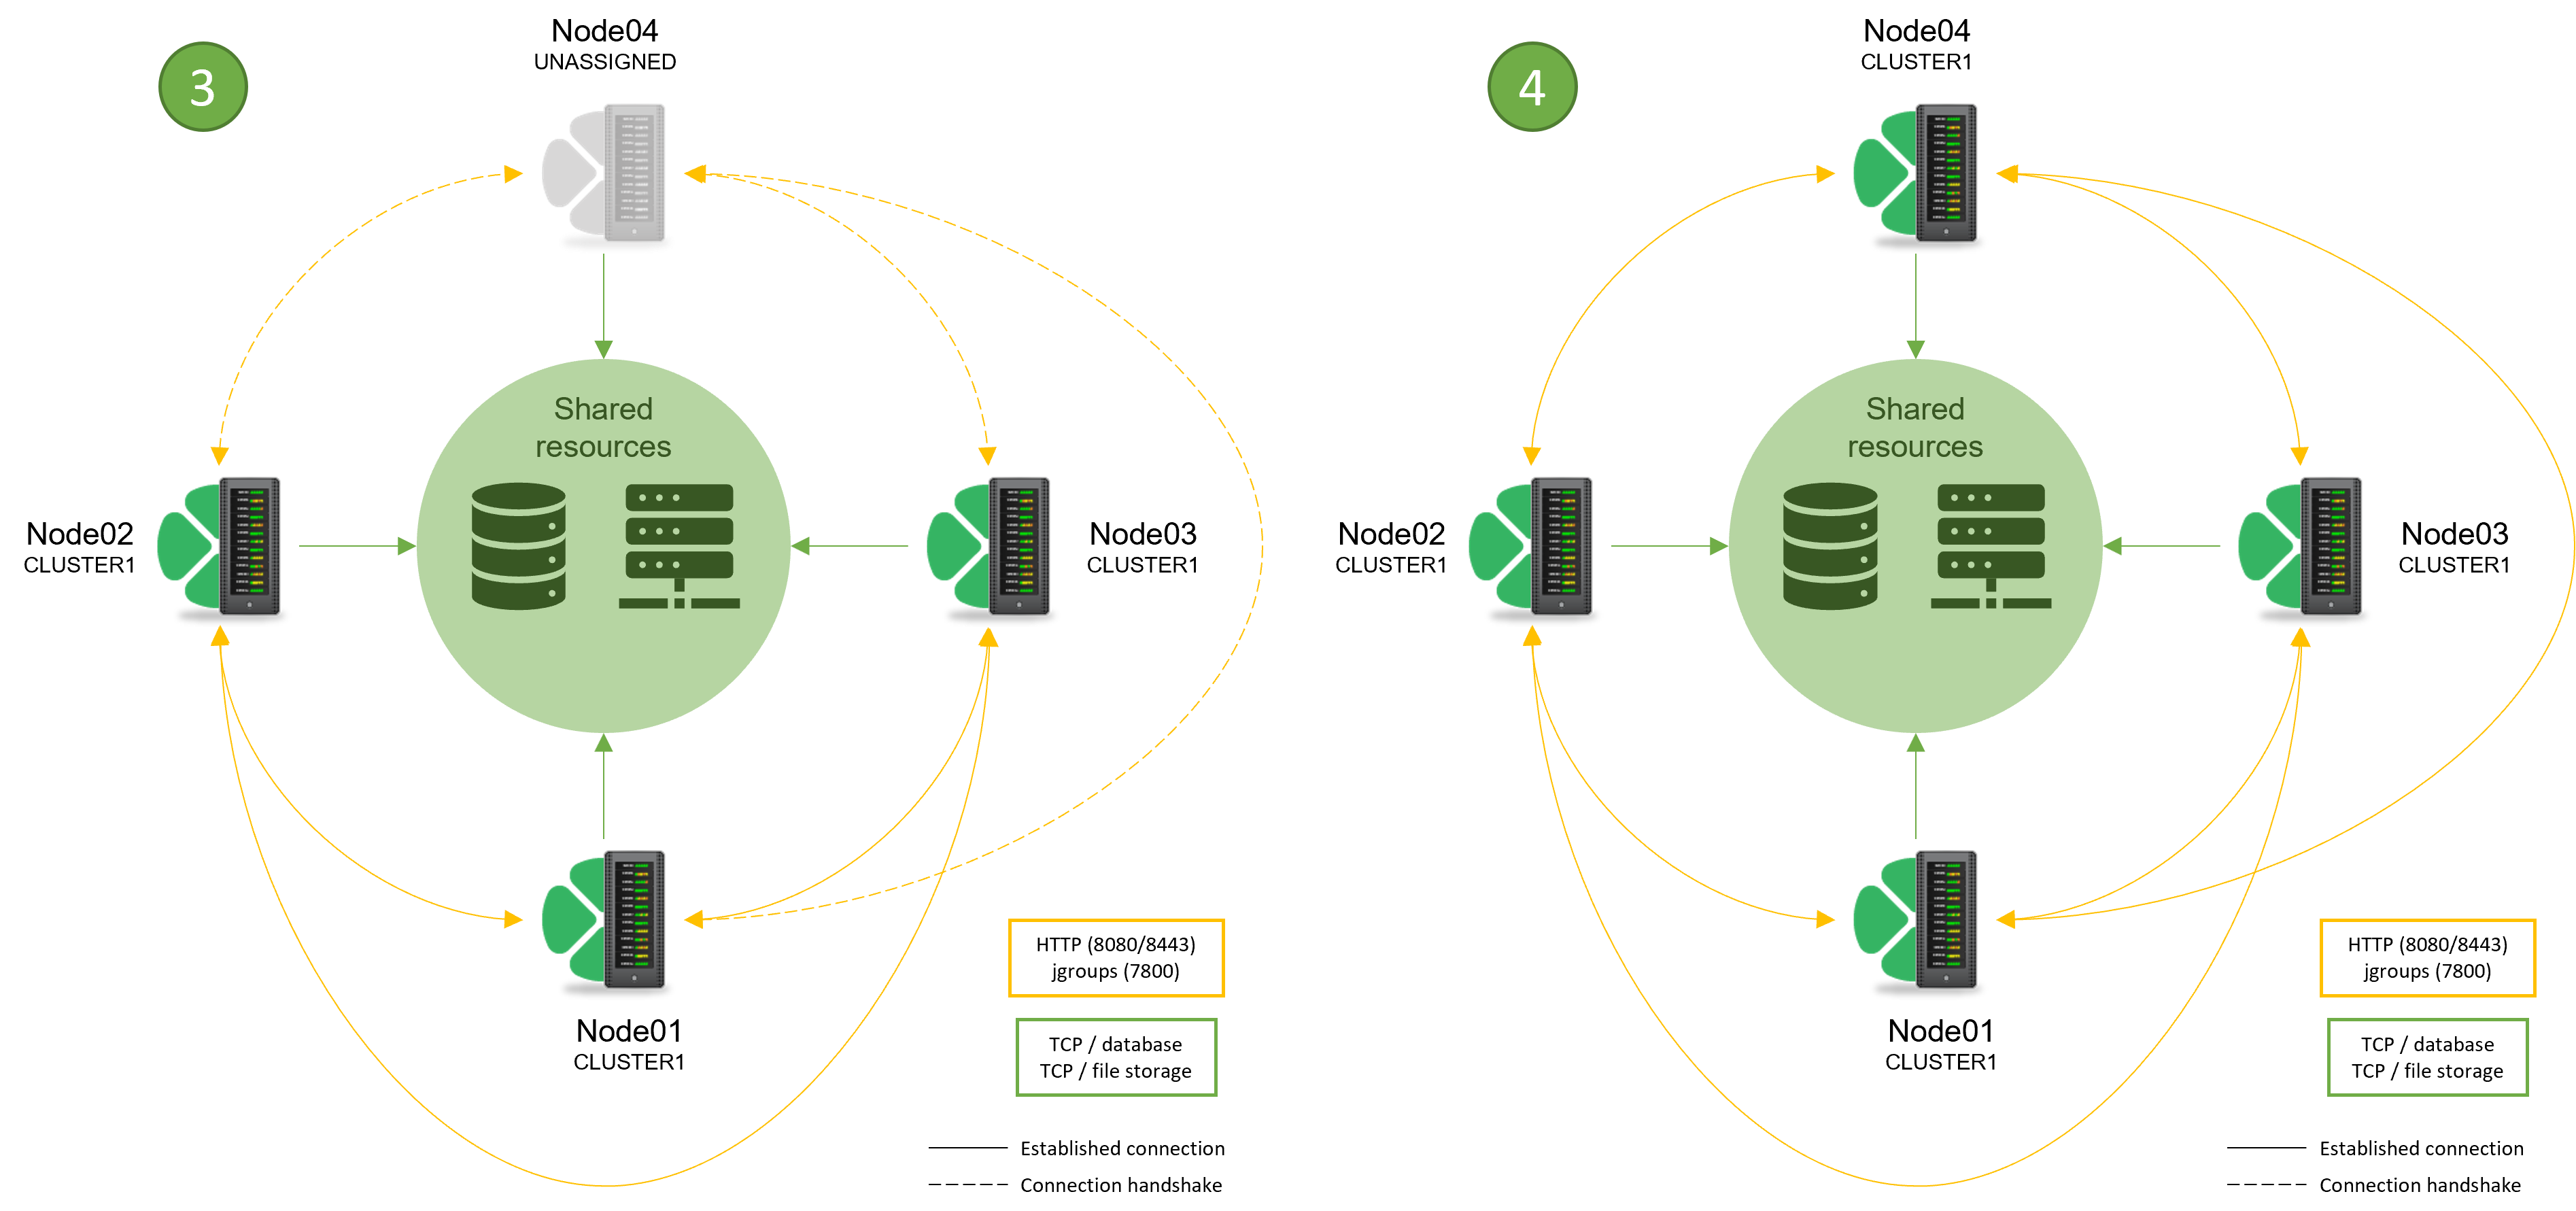
Server node connection process
When a new server should join existing cluster, it first sends a “hello” message. This is represented by an entry in the common database. With next sync, other cluster nodes verify if new node is accessible for heartbeat checks (default port 7800) and if it is able to accept data payload (default is standard port for used HTTP protocol). If consensus is achieved, new node is accepted and included in load balancing algorithm.
Mirroring actions of existing nodes, new node checks if it can access all existing ones. Information about addresses, non-standard ports and other necessary information is contained in a response of “hello” message sent to the database. Some of this information can also be configured (optional) via cluster.jgroups.tcpping.initial_hosts property. If property is not specified, multiple nodes cannot join cluster at the same time.
If cluster cannot verify accessibility of new node, they switch its status to “Suspended” to exclude it from load balancing algorithm.
Simplified connection process schema:
Using templates to configure server nodes
In several 5.x releases, updates were made to make templating of deployments using tools like Ansible, Docker Compose and similar, easier. These tools are usually capable of injecting environment variables or have other means to parametrize an instance which can now be leveraged in Server node’s configuration.
Environment and system variables can be used when building common CloverDX Server configuration file. In cluster deployments, there are typically only 2 to 3 properties which differ instance to instance:
- cluster.node.id
- cluster.http.url
- webGui.instance.label
Others tend to be mirrored across entire cluster, even though they are be permitted to differ. File paths for example. How to set an environment variable you can use in CloverDX Server configuration file depends on your orchestration engine. Examples can be found in their respective documentation, see Ansible, Docker (Compose) or Kubernetes or whichever engine you may have.
cluster.node.id
Is a cornerstone of cluster configuration. This property must not change for specific local persistent storage (i.e., state information). If that happens, some frontend and backend features may stop working properly. This property is usually provided from an external orchestrator directly (Ansible, Docker, …) on instance creation (e.g., cluster.node.id=${env:CLOVER_NODE_ID}).
cluster.http.url
An address (URI) of Server node. This may sometimes be out of control of orchestrator, requiring a system command to be executed when instance is started. Frequently, it can be as simple as exporting an environment variable via custom script in .profile (or /etc/profile.d) of CloverDX Server process owner: export CLOVER_HOST=”`hostname -f`”, then set property can be provided to configuration file like so: cluster.http.url=${env:CLOVER_HOST}.
Some environments may require an access to instance metadata using CLI tools (e.g., via AWS EC2 console), etc. but the general idea should be very similar.
webGui.instance.label
Even though, not technically required (only used in GUI) but serves to better recognize an instance user is logged into. This may come in handy especially when nodes are behind common HTTP reverse proxy. Same as with cluster.node.id, may be provided by an external orchestrator either using same or other ( user-friendlier) label (e.g., webGui.instance.label=${env:CLOVER_NODE_ID}).
Dynamically scaled environments
In SaaS deployments where CloverDX is sometimes used; one of the critical metrics is infrastructure cost. Infrastructure autoscaling is very useful tool to minimize such costs, pushed as a big selling point of Cloud Computing providers. CloverDX Cluster can be used in such operations but some rules need to be followed:
- Cluster Node IDs must be recycled (not necessarily in the same VM)
- Local persistent storage should not be transient (removed) when VM/container is shut down
- External monitor / orchestrator needs to be used to manage running instances
Most of the performance monitoring used to determine utilization of entire cluster is provided by CloverDX Server’s REST API – most notably CPU and memory utilization, total number of jobs running on each Server node in a cluster.
Adding a Server node to the cluster is simple – start a Server node with compatible configuration. This is enough as all necessary steps are handled behind the scenes. Detaching Server node from the cluster may be more challenging as there is no concept of “finish and shutdown” action. Immediate termination of a Server node would result in failure of every job currently running on it and by extension, every job which got delegated from the cluster.
Graceful termination of a Server node
Before termination, it is necessary to stop all operations (prevent Server from running any new jobs and let finish jobs currently in progress). To accomplish this, Server node needs to enter Suspended mode – this mode prevents running new jobs under normal circumstances. There are 2 possible transitions into the Suspended mode; Suspend and Suspend at once. Former leaves existing jobs to finish, latter forcefully terminates any running jobs immediately. In cluster setting, this option may cause job failures across all Server nodes in related execution tree.
Conclusion
CloverDX Cluster is a powerful tool to increase robustness and computing power without any additional effort after initial setup is done. Given its historical focus on statically sized clusters in a single location, it may provide some challenges when it comes to SaaS-like auto-scaling but with an understanding of its internal function and techniques allowing parametrization of individual nodes, this limitation can be worked around using transient compute instances with persistent mountable drives.
More from Tech Blog
-
CloverDX Server diagnostics with ChatGPT or Claude via MCP
Administrating a healthy CloverDX Server usually means correlating information scattered across performance logs, job tracking tables, execution logs,... AI -
Data Quality Examples on GitHub
As our first set of examples, we published a project called DataQualityExamples which demonstrates how users can address their data quality issues with... CloverDX How-To -
Introducing CloverDX Examples on GitHub
We’re excited to introduce the CloverDX Examples repository on GitHub. The repository is a growing collection of helpful and practical examples designed to... CloverDX How-To -
Sending emails via Azure Communication Services SMTP
There are many situations where it is helpful to get a message from your active pipelines. These may include logs, summaries of successful completion, or... Cloud -
Connecting to REST APIs (OpenAPI)
Connecting to REST APIs is a crucial aspect of modern data integration, and the REST Connector in CloverDX provides a streamlined approach. The video below... RESTConnector -
Performance tuning: How to troubleshoot database-related performance issues in CloverDX
Performance is undoubtedly one of the key factors when running data transformations. In this article, we will look at how to troubleshoot database-related... Performance
Visit CloverDX Blog
-
How financial services firms use automation to cut reporting from days to half a day
-
Data integration after an acquisition: How fast-growing companies stay in control
-
Boomi vs CloverDX for enterprise data integration
-
Boomi Alternatives: A Complete Guide (2026)
-
Why SaaS engineers are stuck doing manual customer data onboarding – and how to fix it
