A common task an ETL tool has to deal with nowadays is the emergence of data containing a form of geographical information. Just like any other type of data – monetary values, times and dates, etc. – geographical data pose interesting challenges to an ETL developer. Working with different Coordinate Reference Systems (CRS) within a project is a common difficulty. Typically, two or more software systems need to exchange geographical data, but each one of them uses a different CRS.
The ETL process must make sure that the systems in question always get the data in the correct format and CRS. This is where a quick and simple solution comes in handy.
Let’s see how this problem can be easily handled in CloverDX by using a third-party conversion library plugged into a CloverDX transformation.
Note: You can find more information about the CRS used in North America here.
Let’s demonstrate a solution to a data exchange problem between Google Maps and an export for a New York tourist agency running their own map. The export has to be encoded in a different CRS than the one Google Maps uses.
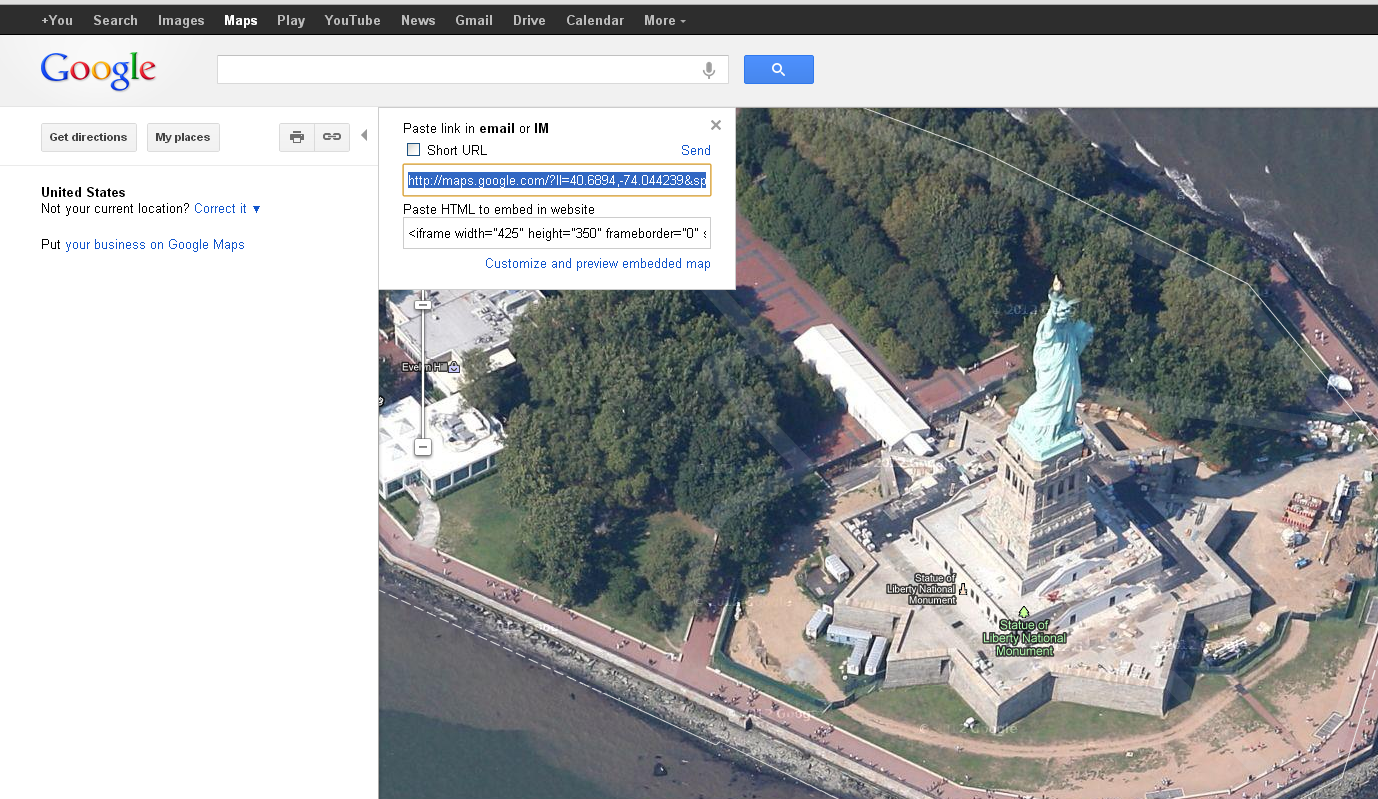
Here, we’re running a web application that allows the user to pick a position on Google Maps and add a note to it. This information is then stored in a database and, since Google Maps uses CRS WGS 84, we get latitude-longitude pairs.
(In the picture below, you can see how to get the latitude-longitude pair from the map. In this case, latitude=40.6894 and longitude=-74.044239):
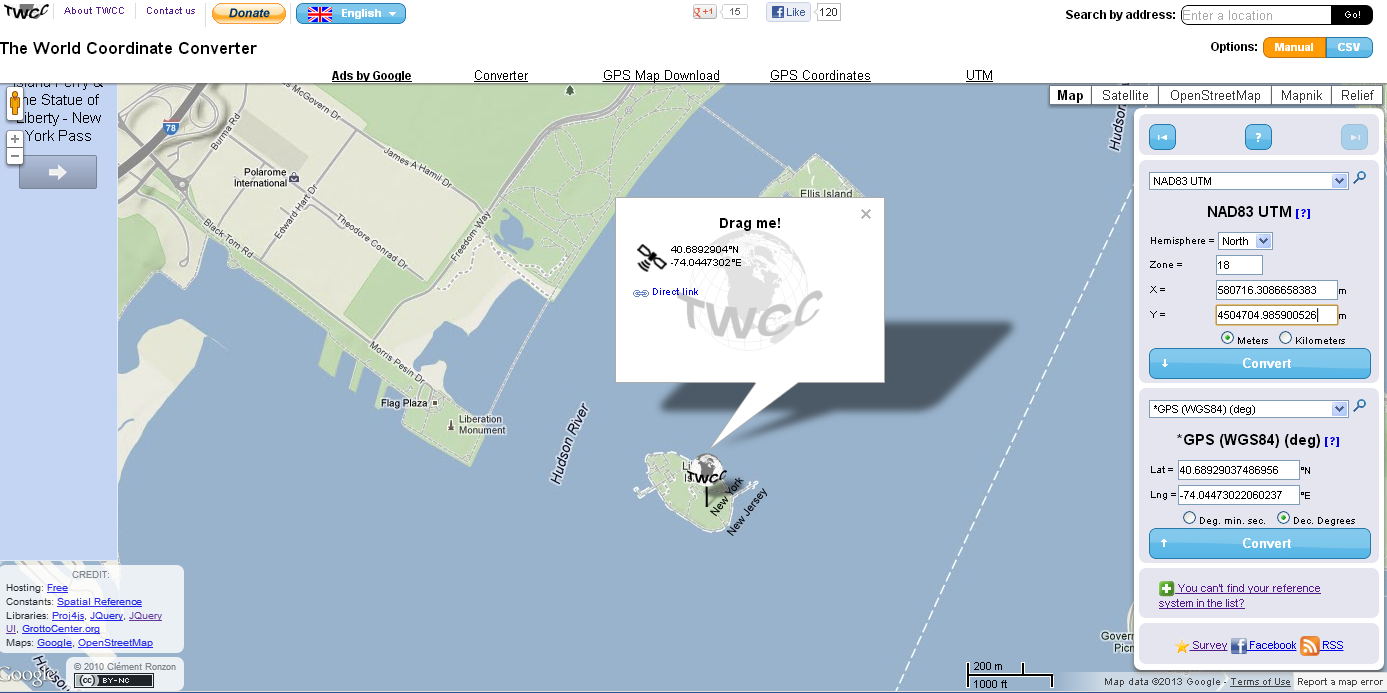
Now let’s say that some New York officials ask us to provide them with our data. They’d like to display it on their own map and they plan to use the density of the notes on the map to define the best attractions for tourists. Unfortunately, their maps use an X-Y metric CRS NAD83 zone 18 and there is no simple conversion from WGS84.
Why is the conversion difficult? Well, the first CRS is defined by a Traverse Mercator projection, and the second one by Oblate Spheroid. This leads to non-trivial math homework and goes beyond what an ETL developer should be concerned with. Fortunately, there are libraries such as GeoTools that can help simplify things.
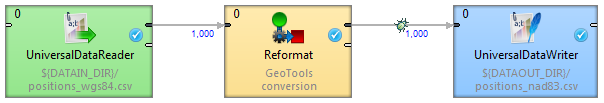
Let’s build a transformation graph that will solve the problem using the GeoTools library. The core conversion will use only three components:
The reader in the beginning reads data from a file in the WGS84 format. In the example download, the first record points to the Statue of Liberty, and the rest is merely random data. Of course, you can replace the reader with anything like DBInputTable or WebServiceClient that will provide the input data instead.
Then, we’ll place a Reformat that will run the conversions for us using the external Java library. Finally, the writer at the end simply writes the converted data back to a file.
The Reformat is there to embed a piece of Java code that calls the external library conversion function for each input record. The full source code is available in the example download, but for now, let’s just look at two of the most important parts.
The initialization part runs only once and prepares the “conversion” object – a MathTransform instance from the library that we’ll use later on the data.
CoordinateReferenceSystem crsFrom = CRS.decode("EPSG:4326");

CoordinateReferenceSystem crsTo = CRS.decode("EPSG:26918");

MathTransform conversion = CRS.findMathTransform(crsFrom, crsTo, true);
The second snippet shows the actual transformation – getting the input data from an edge, passing it into the conversion, and finally, sending the result to an output edge:
double fromPoint[] = new double[] {

       (java.lang.Double) getInputRecord(0).getField(0).getValue(),

       (java.lang.Double) getInputRecord(0).getField(1).getValue()

};

double toPoint[] = new double[2];
conversion.transform(fromPoint, 0, toPoint, 0, 1);
getOutputRecord(0).getField(0).setValue(toPoint[0]);
getOutputRecord(0).getField(1).setValue(toPoint[1]);
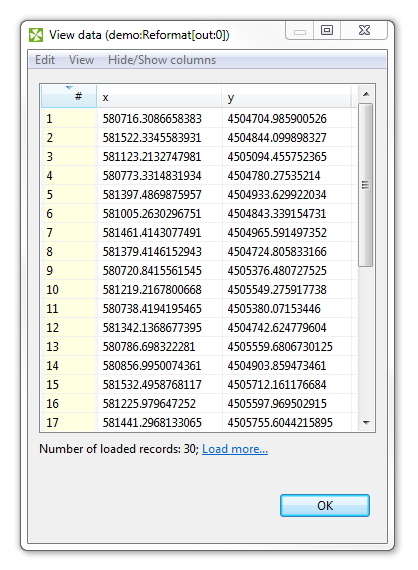
With this set up we can test the results. The output should look like this:
Because the transformation uses an external Java library, we need to put it on classpath of our CloverDX project. To do so, follow these steps:
When this is set, you’re ready to use the Java library in your project’s graphs. This way, you can use any number of third-party tools.
You can download the demo project here: