As data keep getting bigger and more complex, so do the graph and workflows used for processing these data––especially when they are nested within each other. While also granting users much more sophisticated options and functionalities with their graphs, subgraphs also added another layer of complexity for debugging graphs. It is easy to get lost in a complex graph; analyzing a long text log can be very difficult and time consuming to search for potential problems and correct them.
In today’s fast and competitive environment, it is crucial to find errors easily and correct them quickly, so you are able to use your data as soon as possible. To address this, we’ve introduced another important feature in the new CloverDX 4.0. It’s called the Execution View, and it is focused mainly on helping you detect and fix errors in your data integration jobs. While it probably isn‘t so visible and readily usable as subgraphs and metadata propagation, it is, however, for developers and support personnel, a very important feature. It will save them a lot of time and effort in tracking and fixing possible problems, and thus effectively shortening the time between development and production.
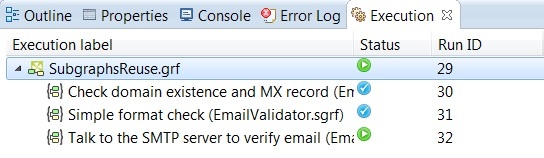
So what exactly is the Execution View? In short, it is new tool that allows you to inspect your jobs. Basically, it visualizes the log for any running ETL job.
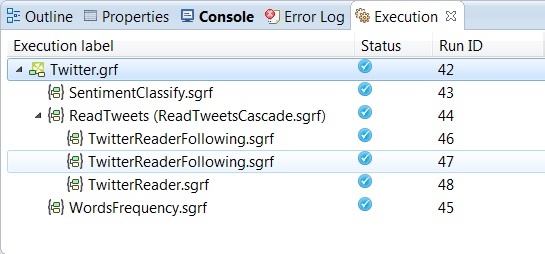
As you can see in the picture, it will split your job into subjobs, making it so you are able to quickly identify where the problem is. You only need to click any subjob to open that part of graph and to start fixing it in a matter of seconds.
Here is an example to illustrate this concept. Let’s take a look:
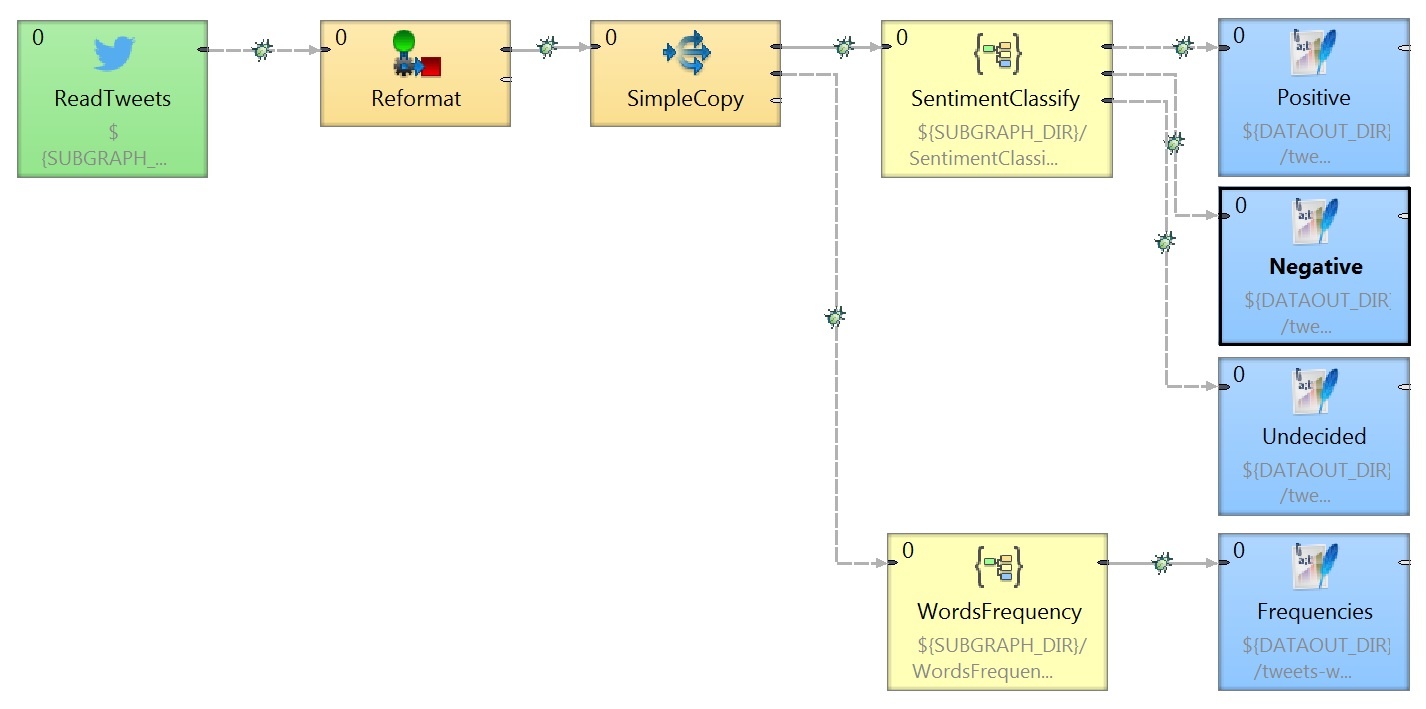
This is a graph for sorting through social signals from Twitter. It contains several subgraphs and other subgraphs nested in it. Analyzing this only through error logs would take much more time compare to a well-arranged visualization from the Execution View.
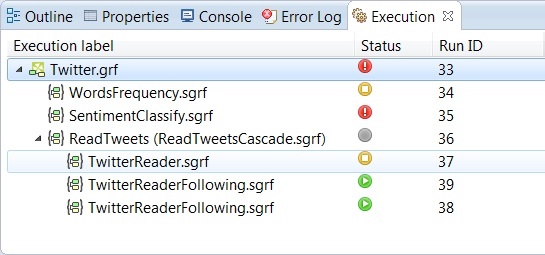
You are able to spot errors in seconds. If you click on the error, it will immediately takes you directly to the spot where the error occurred, and you are able to debug and correct it instantly.
After removing the problem, you can run the process again to assure that it is already running smoothly, without any errors.
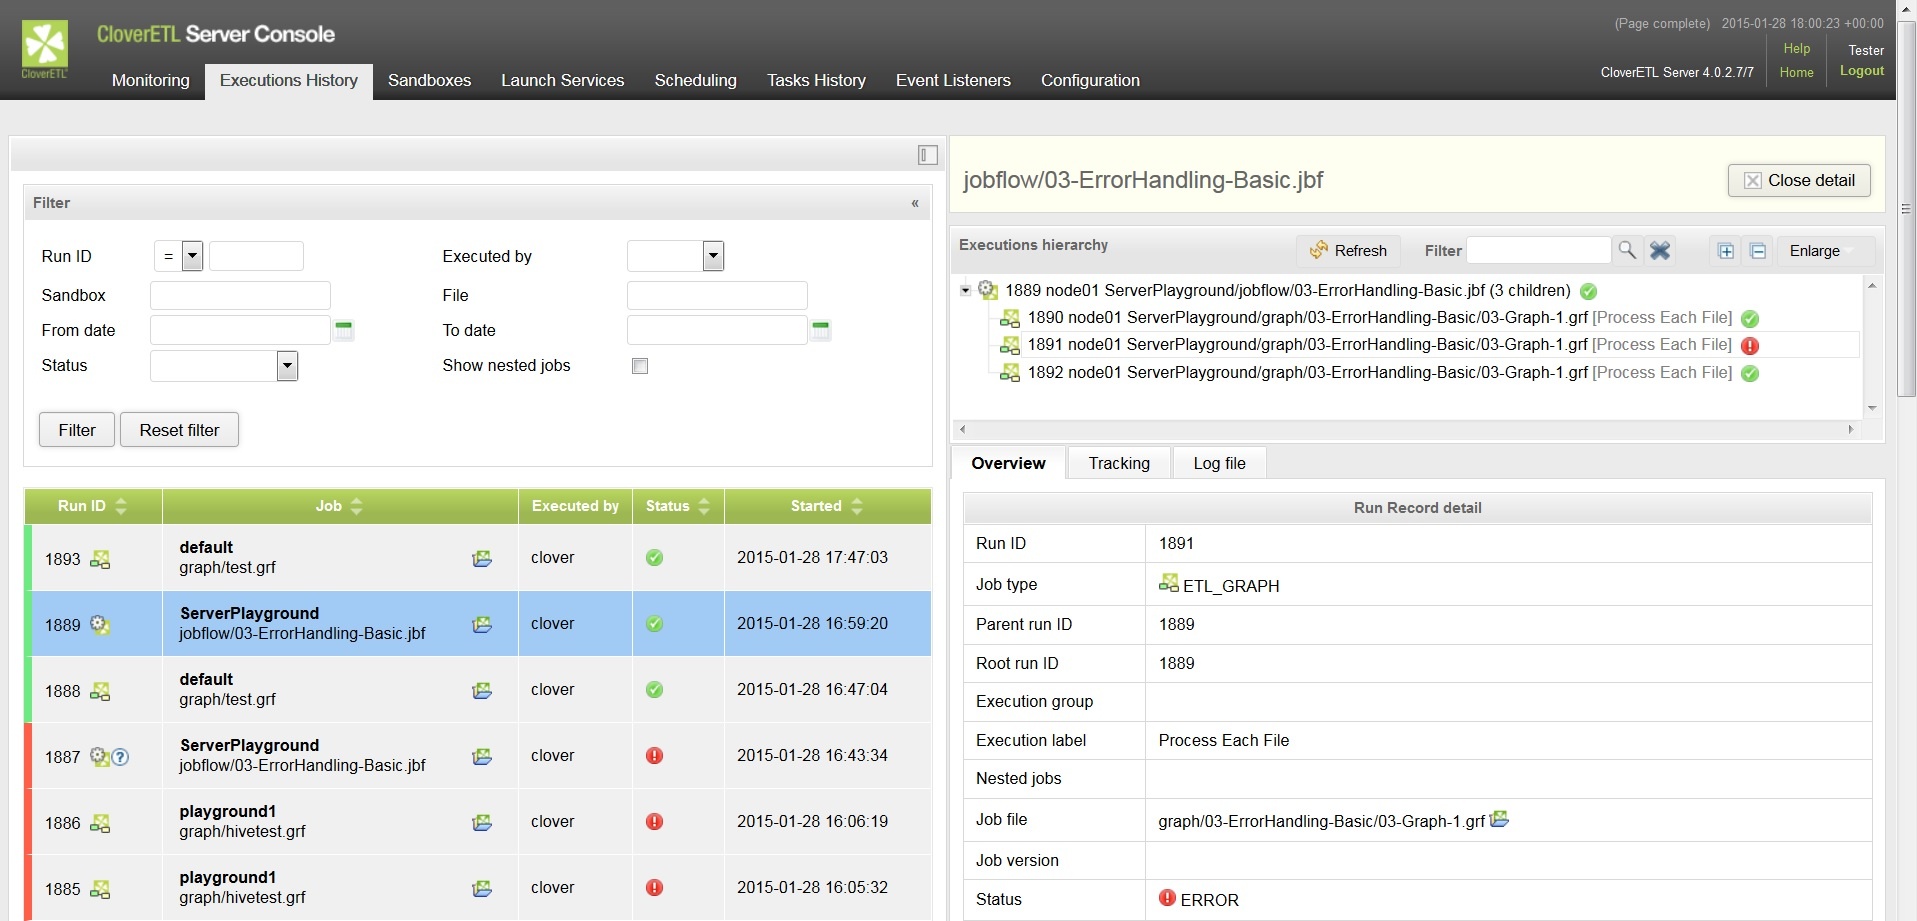
Support departments will be able to utilize this feature too. Imagine a situation like this. You are running your data process on the server and you are notified that there was some problem with one of the jobs. In previous iterations of CloverDX, you would have had to find out what was the problem in the text log, and then have to find the graph, open it in Designer, and try to debug it and correct the problem.
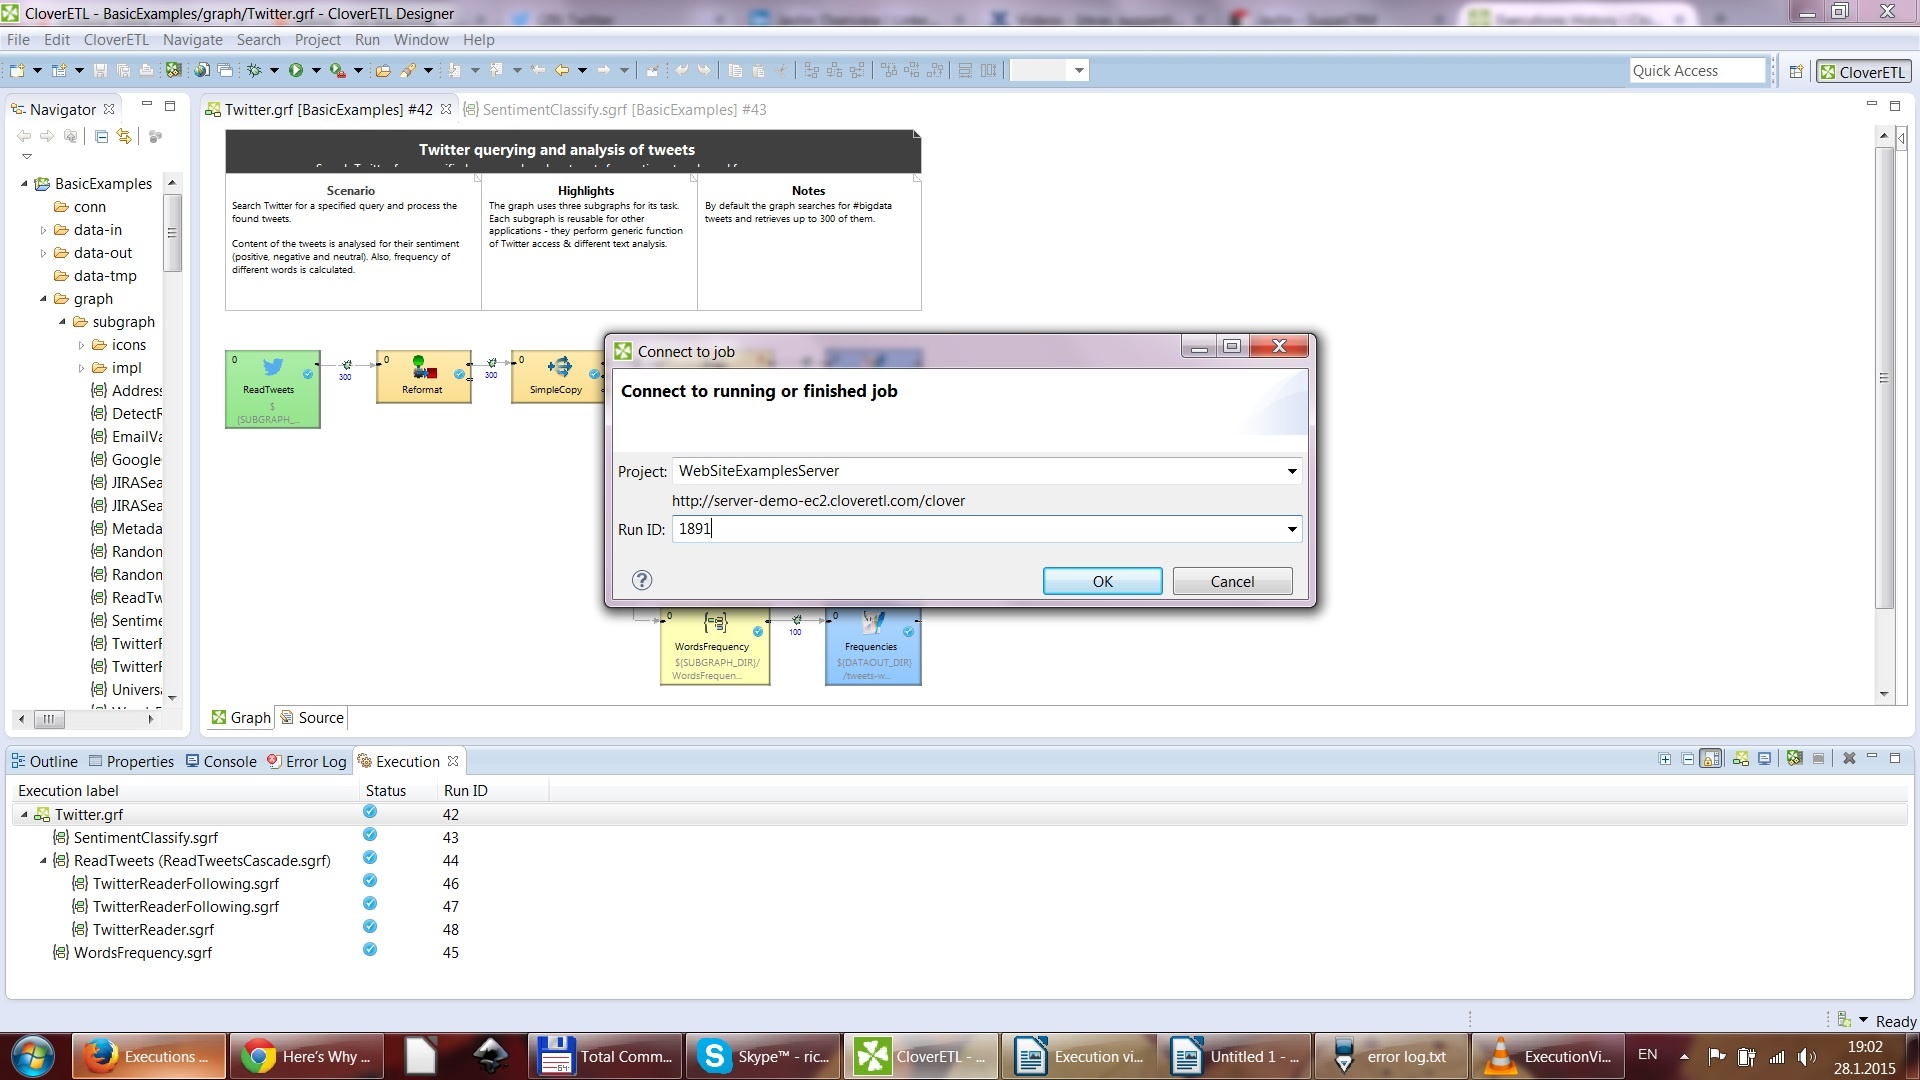
Thank to the Execution View, all you need is the job number. You can now take job number from server.
Enter it into Designer and connect to the server.
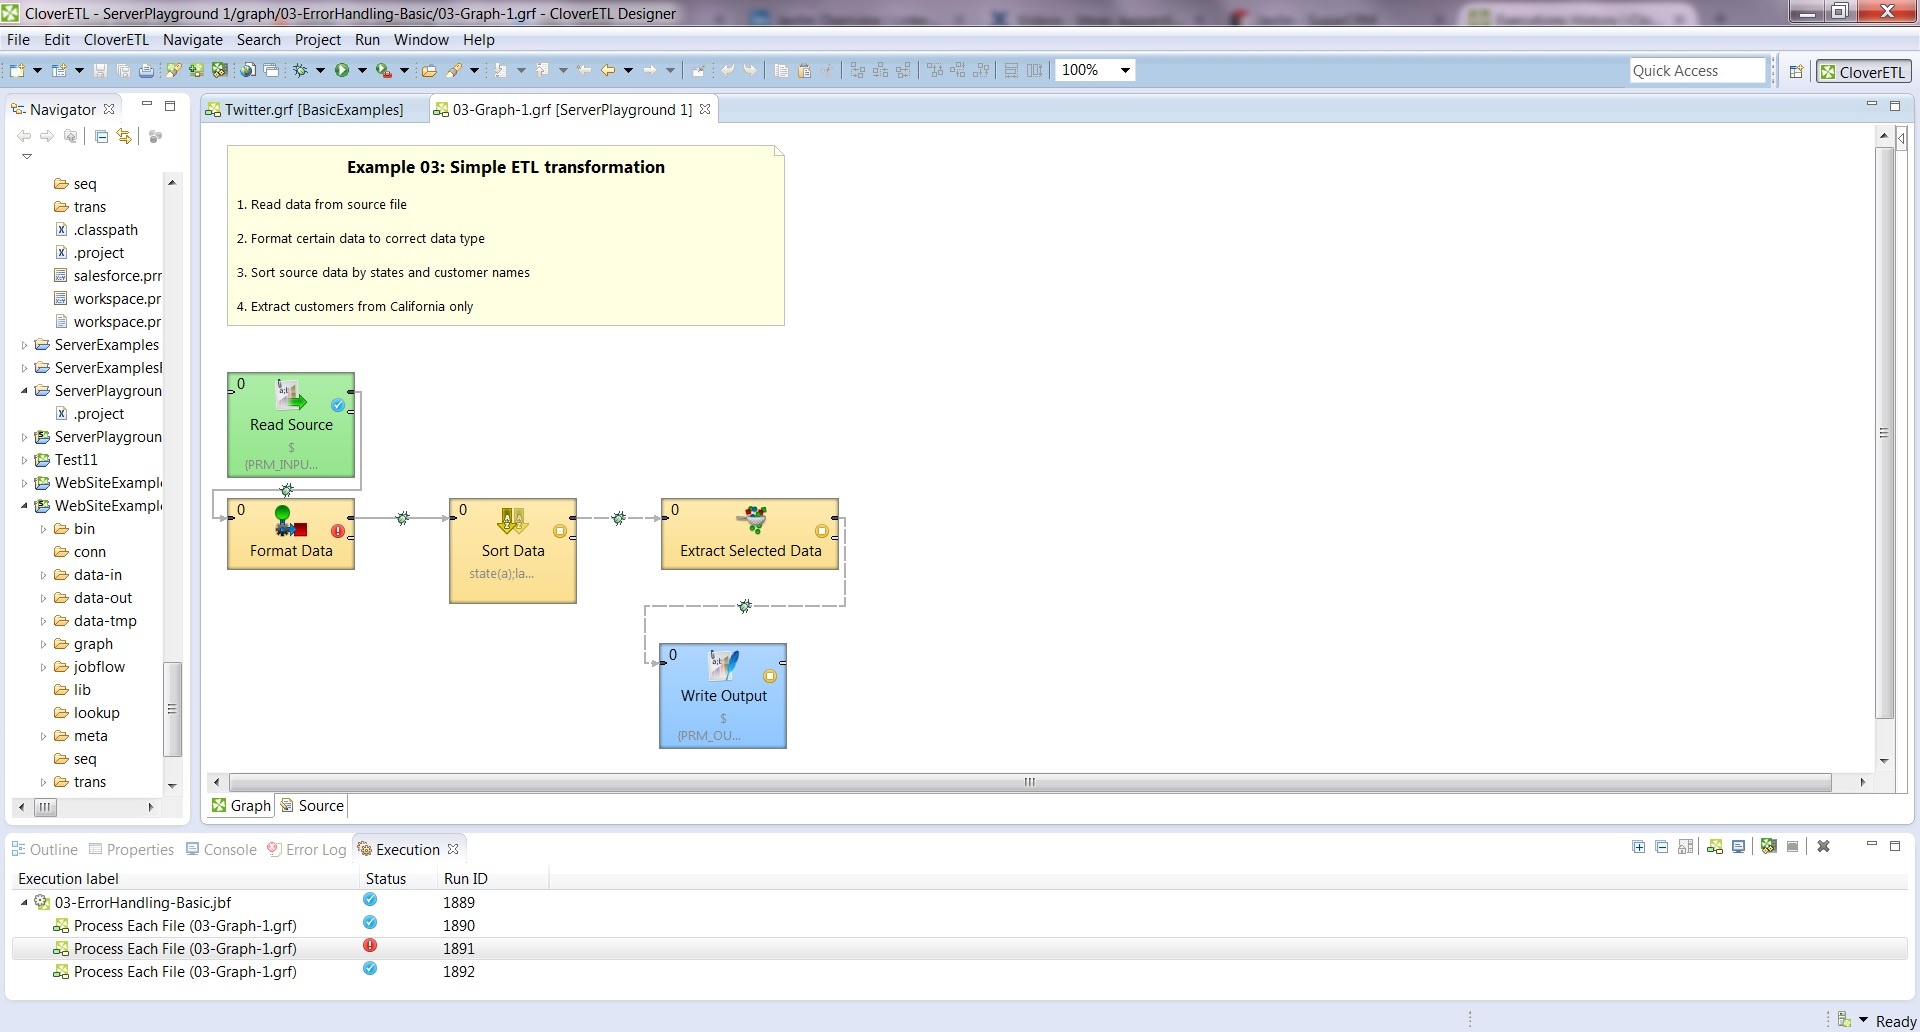
Execution View will retrieve the graph together with data from this job, so that you are able to see what was happening on this particular job, allowing you to easily find and remove any problems.
This function is available for both running and finished jobs. This means that if you have a process that usually finishes in 20 minutes and now it is running for a much longer time, you can connect to this process and see what is going on with the process, and what might be slowing it down.
As you can seem, the Execution View is an interesting and important addition to CloverDX, helping you to work with your data faster and better. You can try this feature right away in the trial version of CloverDX 4.0.